 |
| Remember last week when I got too lazy and bored to correctly normalize things in the newspaper column detection stuff? This is probably the correct normalization. v1 = col_mean / col_sigma; v2 = (v1 - median(v1))/madsig(v1). This is essentially centering and whitening the tracer signal from last week (v1 here). |
Monday, 1 February 2016
Normalization followup to last week

Wednesday, 27 January 2016
I just spent a large chunk of the evening fighting something, even after I'd come to an answer I was happy with.
The problem is fairly easy to state: given a printed page, can you reliably determine the column boundaries? The answer has to be "easily, duh," right? So, I found a bunch of newspaper images with different numbers of columns, and did some tests.
So that kind of looks like garbage. Without the normalization, it becomes obvious that at column gaps, the signal (the mean or median) goes up, as the intensity is brighter. However, the variance (sigma or MAD-sigma) goes down, as the column becomes more uniform. Therefore, if you divide the one by the other, these two features should reinforce, and give a much clearer feature:
So, applying it to the image corpus:
First, I wrote a program that did regular and robust statistics on a column-by-column basis, and plotted these up.
 |
| The test image. |
 |
| The normalizations are simply the mean of the given statistic. |
So that kind of looks like garbage. Without the normalization, it becomes obvious that at column gaps, the signal (the mean or median) goes up, as the intensity is brighter. However, the variance (sigma or MAD-sigma) goes down, as the column becomes more uniform. Therefore, if you divide the one by the other, these two features should reinforce, and give a much clearer feature:
 |
| Which it does. |
So, applying it to the image corpus:
 |
| http://freepages.genealogy.rootsweb.ancestry.com/~mstone/27Feb1895.jpg |

 |
| http://www.thevictorianmagazine.co.uk/1856%20nov%2022%20web%20size/1856%20nov%2022%20p517.jpg |

 |
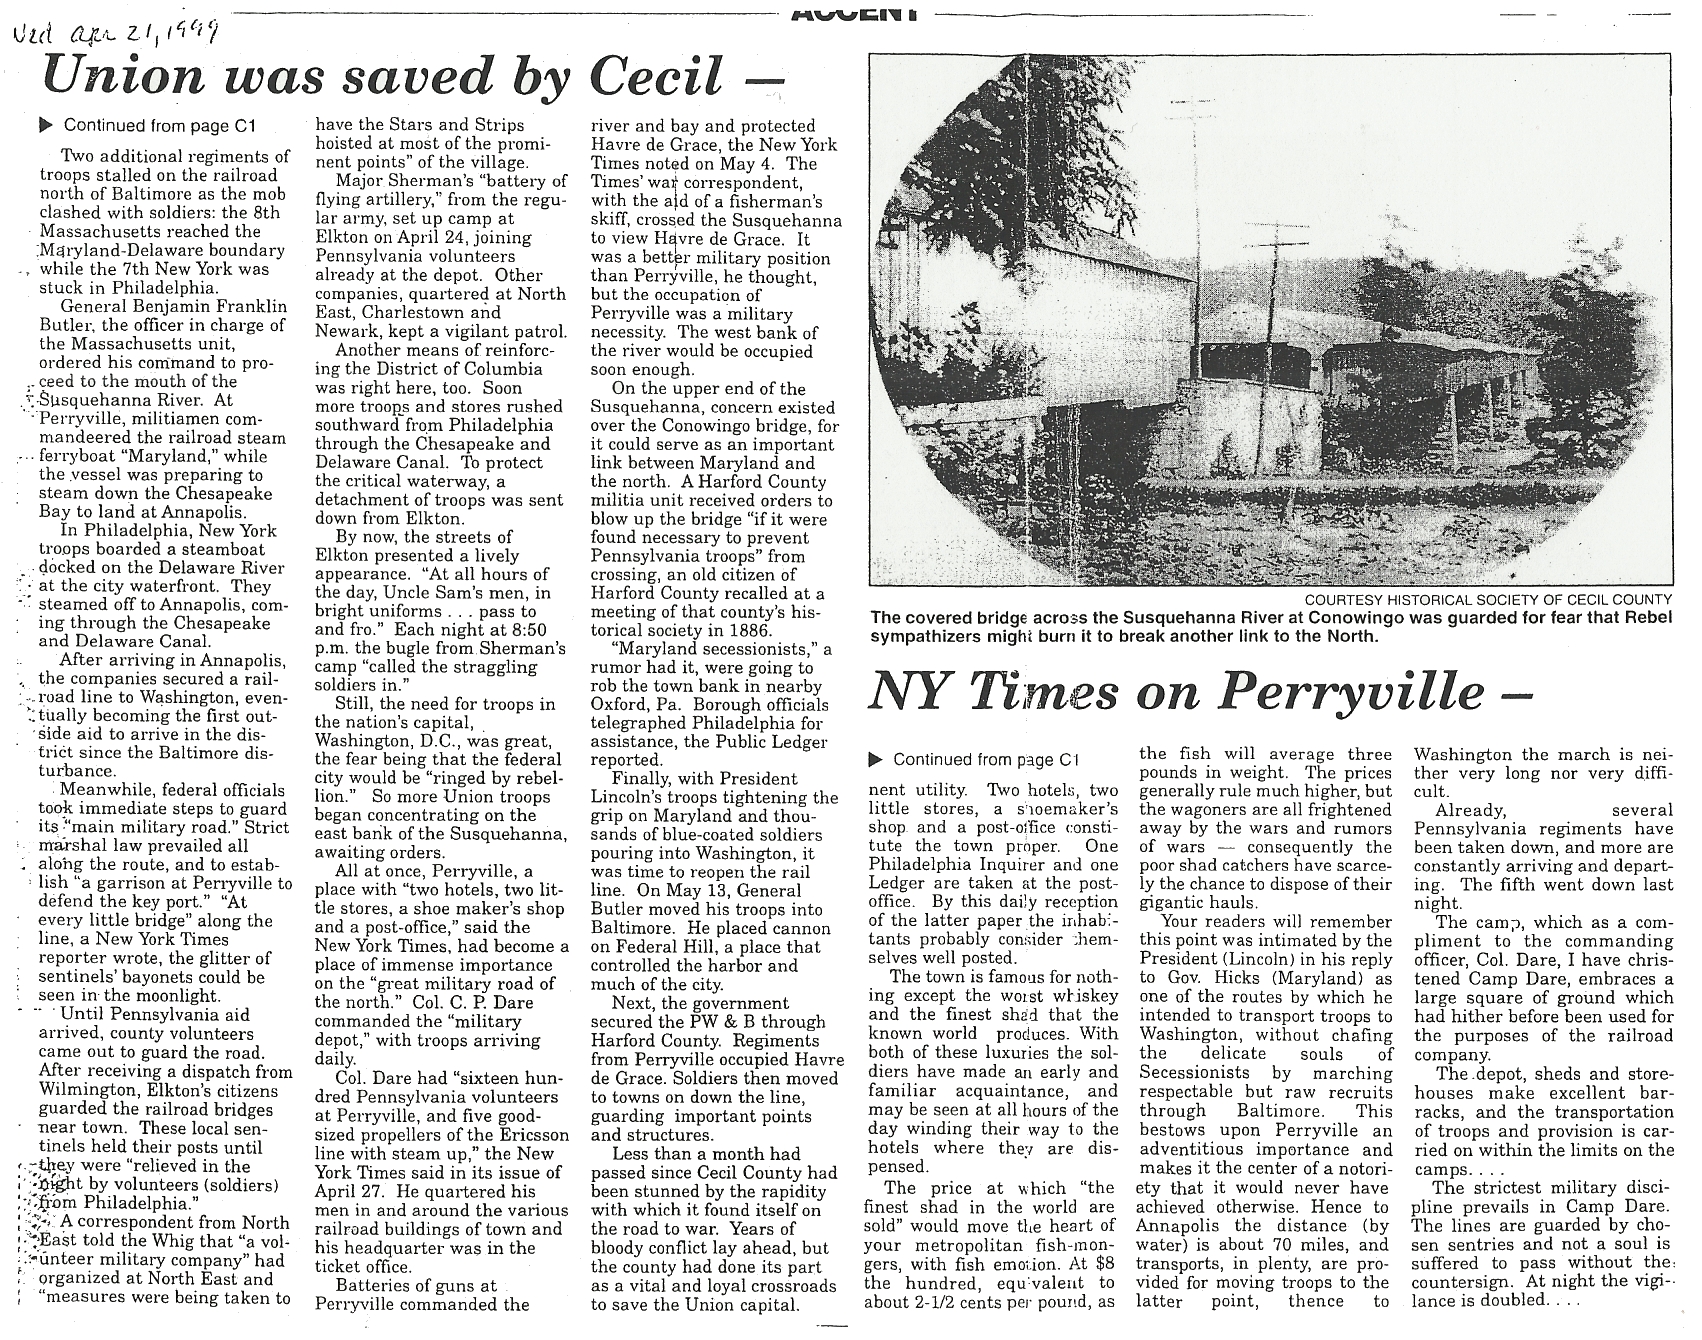
| http://www.angelfire.com/pa5/gettysburgpa/23rdpaimages/cecilcountydare2.jpg |
 |
| http://malvernetheatre.org/wp-content/uploads/2012/07/Malverne-Community-Theatre-Newspaper-Reviews-14-page-0.jpg |

 |
| https://upload.wikimedia.org/wikipedia/commons/b/b8/New_York_Times_Frontpage_1914-07-29.png |

 |
| http://www.americanwx.com/bb/uploads/monthly_01_2011/post-382-0-70961700-1295039609.jpg |

 |
| http://s.hswstatic.com/gif/blogs/vip-newspaper-scan-6.jpg |

I probably should have kept the normalization factor, but that would require calculating them and sticking them in the appropriate places in the plot script, and I was just too lazy to do that. Still, this looks like it's a fairly decent way to detect column gaps. The robust statistics do a worse job, probably because they attempt to clean up the kind of deviations that are interesting here. Compared to the baseline level, it looks like the gaps have a factor of about 10 difference. It really only fails when the columns aren't really separated (or they might be, if I bothered normalizing the plots and clipping the range better).
Thursday, 10 December 2015
IRLS, but without having a line to fit.
 |
| My boss told me to think about applying the iteratively reweighted least squares to fitting a static data set. So it's not really least squares so much as iteratively reweighted weighted means. And in the single dimension test case I knocked together in about ten minutes, it converges in about five iterations to the correct solution for basically all contamination rates up to the point where the contaminated sample is 100% the size of the real sample. This makes it switch over to fitting the contaminating sample. Makes sense. |
Tuesday, 30 June 2015
weighting functions
For IRLS fitting.
 |
| This clarifies why some of the weights were coming out the same, and why I was overfitting in a previous iteration. |
It generally looks like all of these are largely equivalent. Except, obviously, for the one that blows up at x=0, which was my typo weight.
Sunday, 22 March 2015
How many people are left?
I had time this evening to finally sit down and code up a simulator to answer the question I keep having when I watch this Last Man on Earth show (which I don't think is very good, since half the cast play horrible people, and because I can use the phrase "half the cast" on a show with that title). Given that one person survived whatever killed everyone, how likely is it that there's another person alive as well. This is basically a Bernoulli trial problem, where we don't know k or p. I'm taking N = 300e6, which is close enough to the population of the US. The results:
If you think you're the only one alive, then you estimate that lp = -8.4. However, once you find out that another person is alive, then lp >= -8.3 is the minimum (in this resolution), and those two cases have similar probabilities. If you assume that k = 2 is the most likely probability, this moves lp to -8.1, and you have strong evidence that a third and fourth survivors are also likely. Finding the third again bumps things up, and you can start expecting up to 8. A fourth? You've reached the other end of the simulation, and although the dynamic range of probability ratios increases, it's not excessive.
Basically, once the guy found Kristen Schaal, he's no longer the last man on Earth, and the likelihood of finding a lot more people jumps. I will say that his strategy of travelling around writing the city he's living in seems like a good idea, assuming he wrote on a sign there that he's still driving around looking for people if they don't meet him. That way, people will stay there and wait instead of assuming it's empty as well. If he did meet a city with survivors, he could just change that sign to redirect to survivor-town.
 |
| Normalized to the probability that everybody died, with the curves ranging for logarithmically spaced p values from 10**-8.4 to 10**-7.8. |
If you think you're the only one alive, then you estimate that lp = -8.4. However, once you find out that another person is alive, then lp >= -8.3 is the minimum (in this resolution), and those two cases have similar probabilities. If you assume that k = 2 is the most likely probability, this moves lp to -8.1, and you have strong evidence that a third and fourth survivors are also likely. Finding the third again bumps things up, and you can start expecting up to 8. A fourth? You've reached the other end of the simulation, and although the dynamic range of probability ratios increases, it's not excessive.
Basically, once the guy found Kristen Schaal, he's no longer the last man on Earth, and the likelihood of finding a lot more people jumps. I will say that his strategy of travelling around writing the city he's living in seems like a good idea, assuming he wrote on a sign there that he's still driving around looking for people if they don't meet him. That way, people will stay there and wait instead of assuming it's empty as well. If he did meet a city with survivors, he could just change that sign to redirect to survivor-town.
Sunday, 15 March 2015
I've spent way too much time on this stupid problem: Endor vs Death Star.
Today's main point is a continuation of thoughts on Ewoks. Earlier this week, I saw this image in my RSS stuff:

That's an imperial shuttle, and those are 20m long, and roughly square-ish. Stamp that footprint around, and I come up with something like 120m * 120m * 60m = 864000 m^3. If the walls are 5m thick, the fill factor for the DS made up of these rooms is 33%. In the first movie, the walls tend to look thin like a regular wall. This yields a fill factor of about 1%. This results in less mass for the DS, which turns out to be super important. The high end mass is steel with fill factor=1.0, or 1.66e19 kg. The low end is aluminum with a 1% fill factor, at 5.8832e16 kg.
Why? The DS blows up. It's a good "kablooey" kind of explosion. Assuming this is going to completely disperse all the mass to infinity, this means the explosion is comparable to the gravitational binding energy, U = 3/5 * GM^2 / R. For our 80km radius, and the high and low mass estimates give binding energies of 1.38e23 and 1.73e18 MJ. This has to be converted to kinetic energy of all the debris particles, so assuming equal mass, each particle gets, U = 1/2 (M/Np) * v^2, so v = sqrt(Np) * [129 7.67] km/s.
What's left to know? Where the DS is located in association to Endor. I remembered this scene:
But that turns out to not help. I had planned to measure the length of the chord on the arc of Endor, and use that to work out how far behind the DS it is. However, since this is the CGI reconstruction of two models on a stage, this doesn't work. Using that chord to work out the projected scale of Endor, given the known "real" radii of the two objects means that Endor is in front of the DS, as the model Endor wasn't big enough to create the correct arc.
This isn't a big deal, as I remembered that the DS is orbiting Endor because there's a shield generator that's protecting it. This means the DS has to be in a geostationary orbit. That wiki page for Endor claims it has a period of 18 hours. So the DS orbits at 18433km, and has an orbital velocity of 1.79km/s (which was yesterday's plot).
Put this all together, and run it through the N-body simulator to see what happens, and you get:
How much does it explode? It explodes all the way. For the randomly placed particles (they all start on the surface of the sphere at 80km), one triggered the "collision" flag in the simulation. This makes sense, as at the distance to Endor, it subtends 0.13radians, which translates to 0.435% of the full sky close to the 1/200 simulation particles hitting. This is still 2.94e14kg being dumped on the planet. That's about a third the size of the Chicxulub impact, although it'd be spread out somewhat instead of being a single impact.
The other fun thing I tried was reducing the explosion strength by slowing the particle velocity:
And searching online for it again led me to this, which is an overly long discussion of a bunch of nonsense about how Endor would have been incinerated by the debris from the Death Star. After thinking about it for a few minutes, I came to the conclusion that that didn't make much sense, as pre-explosion, the DS had to have been moving sufficiently to not crash, so after the explosion, only a small fraction should hit the planet. Right?
So let's throw physics at the problem, and see. According to the Star Wars wiki page, Endor has a radius of 2450km radius. If it has the same average density as the Earth, this gives it a mass of 3.39e23 kg. We're trying to slam stuff into it, however, so let's go with an alternate calculation that the surface gravity is the same as on Earth (the Earth density Endor has about half-Earth gravity). This gives about twice the mass at 8.82e23 kg.
Now we know what the target looks like, but what about the DS? It apparently has a radius of 80km. What does that mean in terms of mass? No idea. It's made of "quadanium steel," so we have to make something up. Is it steel? That's 7.75 g/cm^3. Maybe quadanium makes it lighter, so maybe something like aluminum at 2.70 g/cm^3? Plus, a lot of the DS is empty, because otherwise you couldn't do stuff inside it. So there's a fill factor to deal with. Let's say all the rooms look like this one:
 |
| This one. |
Why? The DS blows up. It's a good "kablooey" kind of explosion. Assuming this is going to completely disperse all the mass to infinity, this means the explosion is comparable to the gravitational binding energy, U = 3/5 * GM^2 / R. For our 80km radius, and the high and low mass estimates give binding energies of 1.38e23 and 1.73e18 MJ. This has to be converted to kinetic energy of all the debris particles, so assuming equal mass, each particle gets, U = 1/2 (M/Np) * v^2, so v = sqrt(Np) * [129 7.67] km/s.
What's left to know? Where the DS is located in association to Endor. I remembered this scene:
 |
| Zap! |
This isn't a big deal, as I remembered that the DS is orbiting Endor because there's a shield generator that's protecting it. This means the DS has to be in a geostationary orbit. That wiki page for Endor claims it has a period of 18 hours. So the DS orbits at 18433km, and has an orbital velocity of 1.79km/s (which was yesterday's plot).
Put this all together, and run it through the N-body simulator to see what happens, and you get:
 |
| It freaking explodes. |
The other fun thing I tried was reducing the explosion strength by slowing the particle velocity:
 |
| Red is 100 times smaller and blue is a 1000. |
In these cases, the particles continue to largely follow the original DS orbit. In the lowest energy case, Endor is spared, and the extra energy goes to kicking particles out.
Monday, 23 February 2015
Trigonometry.
I have five colors of post-it notes, and I want to make a post-it-coaster. The first time I did this, I did it by eye, and it didn't work so well. Last time, I realized that I actually know math.
Five post-its means I'm making a pentagon. The sum of interior angles of a polygon is 180 * (n-2) or 540. There are five such angles, so each one is 108. The excess from the 90 corner of a post it is 18. Converting this to radians tells us that q = pi/10, so tan(q) ~ 1/3 (due to small angle formula). The triangle formed from this has to meet the triangle from the opposite corner halfway across the base post-it (due to symmetry). This means that the intersection point is 1/6 the height of the post-it.
Now all the remaining post-its can be placed, keeping that angle in common.
 |
| The base post-it. |
 |
| Make a mark there. |
 |
| And you get a tiny corner that isn't totally correct, but it's close enough. |
Subscribe to:
Posts (Atom)