I saw this tweet this morning as part of a thread, and it didn't quite seem right to me. The urban/rural factor is certainly one component, but it seems like race and income should also be major factors. Unfortunately I didn't fully dig through the census site to find a data set that contains all those variables, so this is just an analysis of the
census county based urbanization statistics and the
2012 presidential election outcomes on a county basis. To be completely fair, this is only an analysis of the subset of those two data sets that have identical spelling/spacing for the county names, so 3069 counties from the 3222 available in the census sample. A quick check seems to indicate that Alaska and Puerto Rice aren't matched between the two.
In any case, plotting the vote fraction for Barack Obama as a function of urban population fraction doesn't show a overly strong trend:
 |
| There is a lot of scatter in this relation, but there is an uptick for the most urban counties. |
Smoothing the data by taking medians/robust sigma values in 0.02 wide bins shows the uptick clearer.
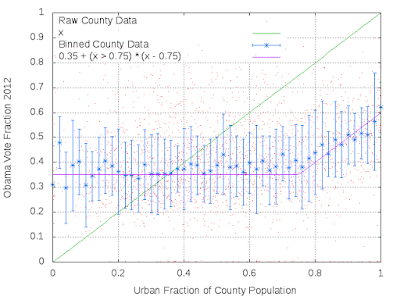 |
| The purple "fit" is simply a constant with a break to linear placed to match the binned data. |
This suggests that for the vast majority of counties, there's little change, but once a certain threshold of urbanization is reached, the median county becomes more likely to vote Democratic as it urbanizes. A fuller description would try to disentangle this effect from racial, economic, educational, and simple population based components.
 |
| One interesting thing to note is that only about a third of the country lives in a county below that break point. This plot is just the CDF of the population data plotted as a function of the urbanization metric. |


No comments:
Post a Comment