 |
| Remember last week when I got too lazy and bored to correctly normalize things in the newspaper column detection stuff? This is probably the correct normalization. v1 = col_mean / col_sigma; v2 = (v1 - median(v1))/madsig(v1). This is essentially centering and whitening the tracer signal from last week (v1 here). |
Showing posts with label image processing. Show all posts
Showing posts with label image processing. Show all posts
Monday, 1 February 2016
Normalization followup to last week

Wednesday, 27 January 2016
I just spent a large chunk of the evening fighting something, even after I'd come to an answer I was happy with.
The problem is fairly easy to state: given a printed page, can you reliably determine the column boundaries? The answer has to be "easily, duh," right? So, I found a bunch of newspaper images with different numbers of columns, and did some tests.
So that kind of looks like garbage. Without the normalization, it becomes obvious that at column gaps, the signal (the mean or median) goes up, as the intensity is brighter. However, the variance (sigma or MAD-sigma) goes down, as the column becomes more uniform. Therefore, if you divide the one by the other, these two features should reinforce, and give a much clearer feature:
So, applying it to the image corpus:
First, I wrote a program that did regular and robust statistics on a column-by-column basis, and plotted these up.
 |
| The test image. |
 |
| The normalizations are simply the mean of the given statistic. |
So that kind of looks like garbage. Without the normalization, it becomes obvious that at column gaps, the signal (the mean or median) goes up, as the intensity is brighter. However, the variance (sigma or MAD-sigma) goes down, as the column becomes more uniform. Therefore, if you divide the one by the other, these two features should reinforce, and give a much clearer feature:
 |
| Which it does. |
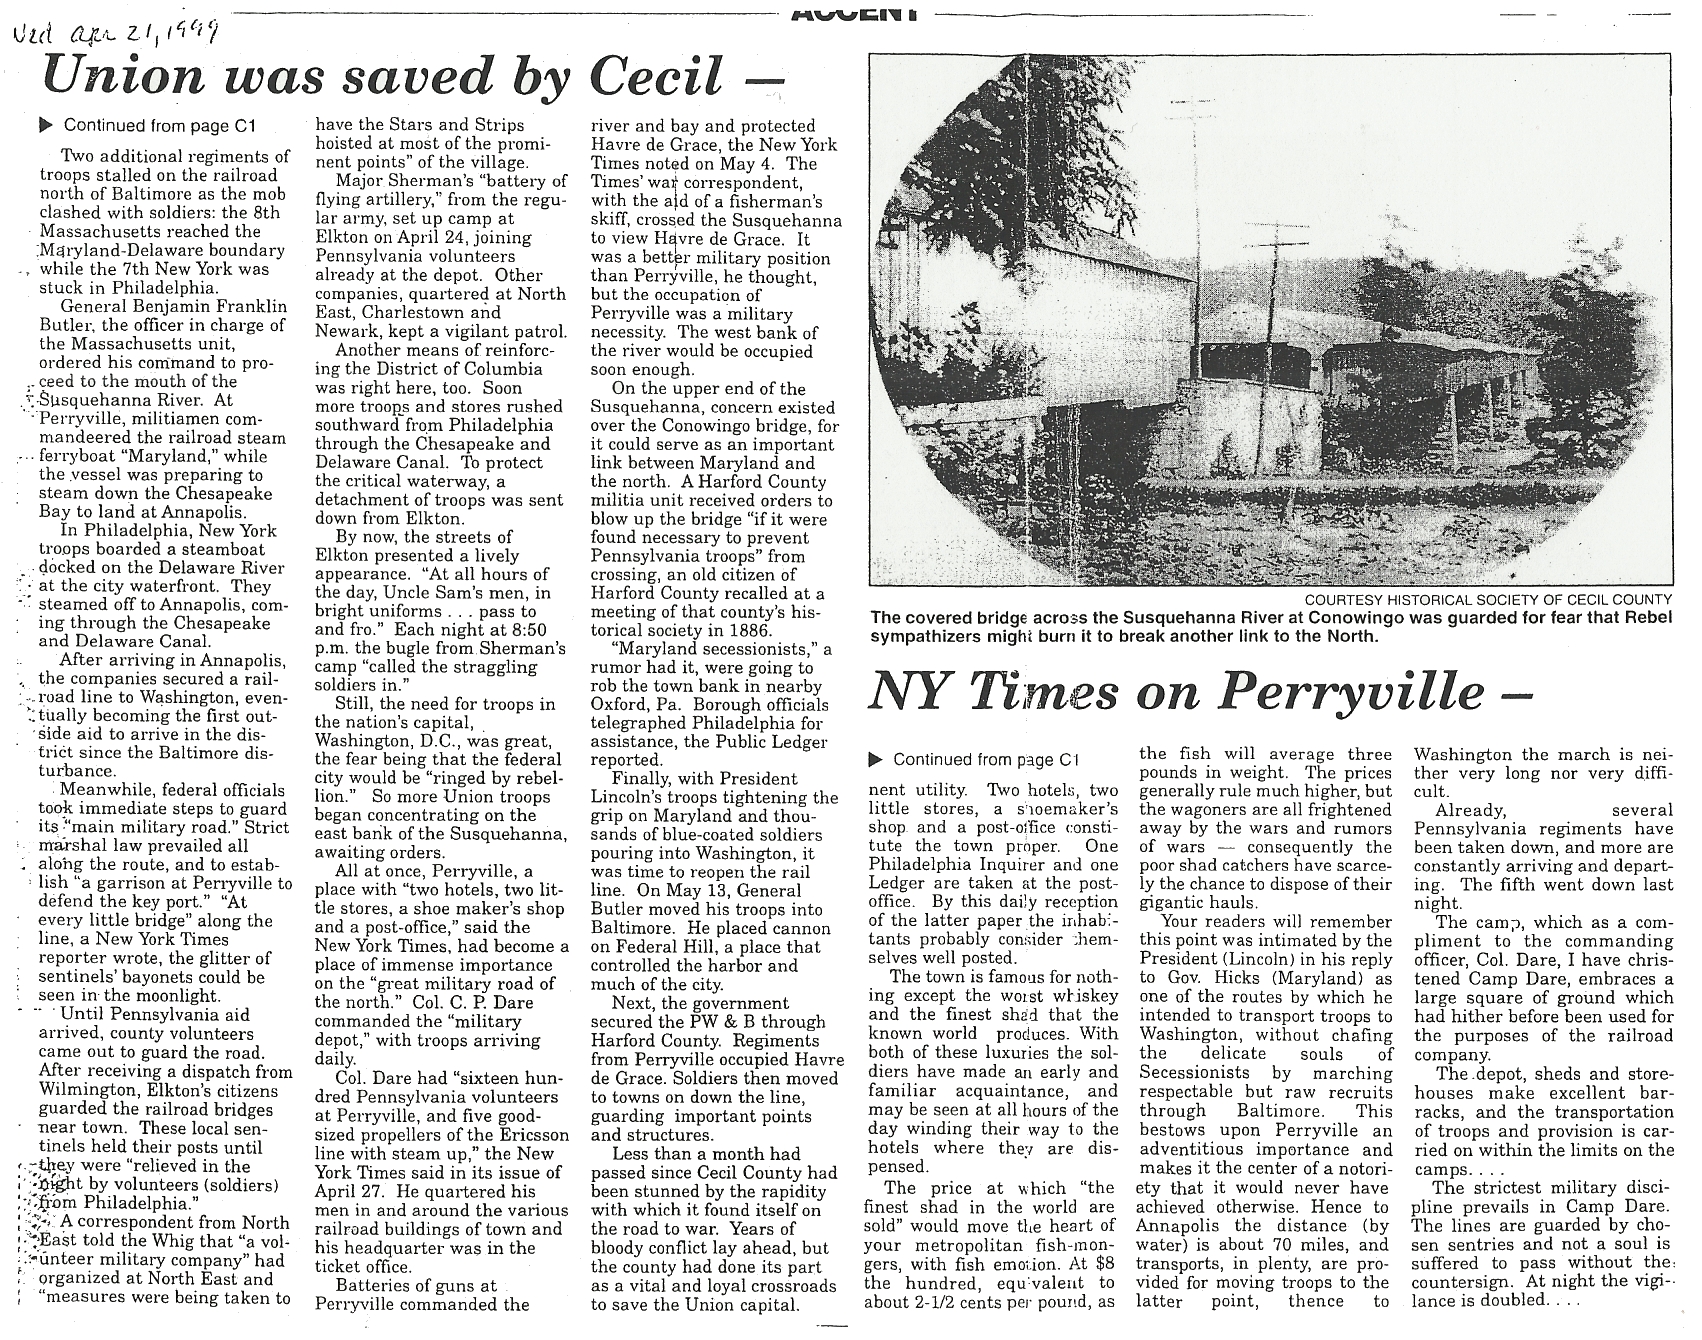

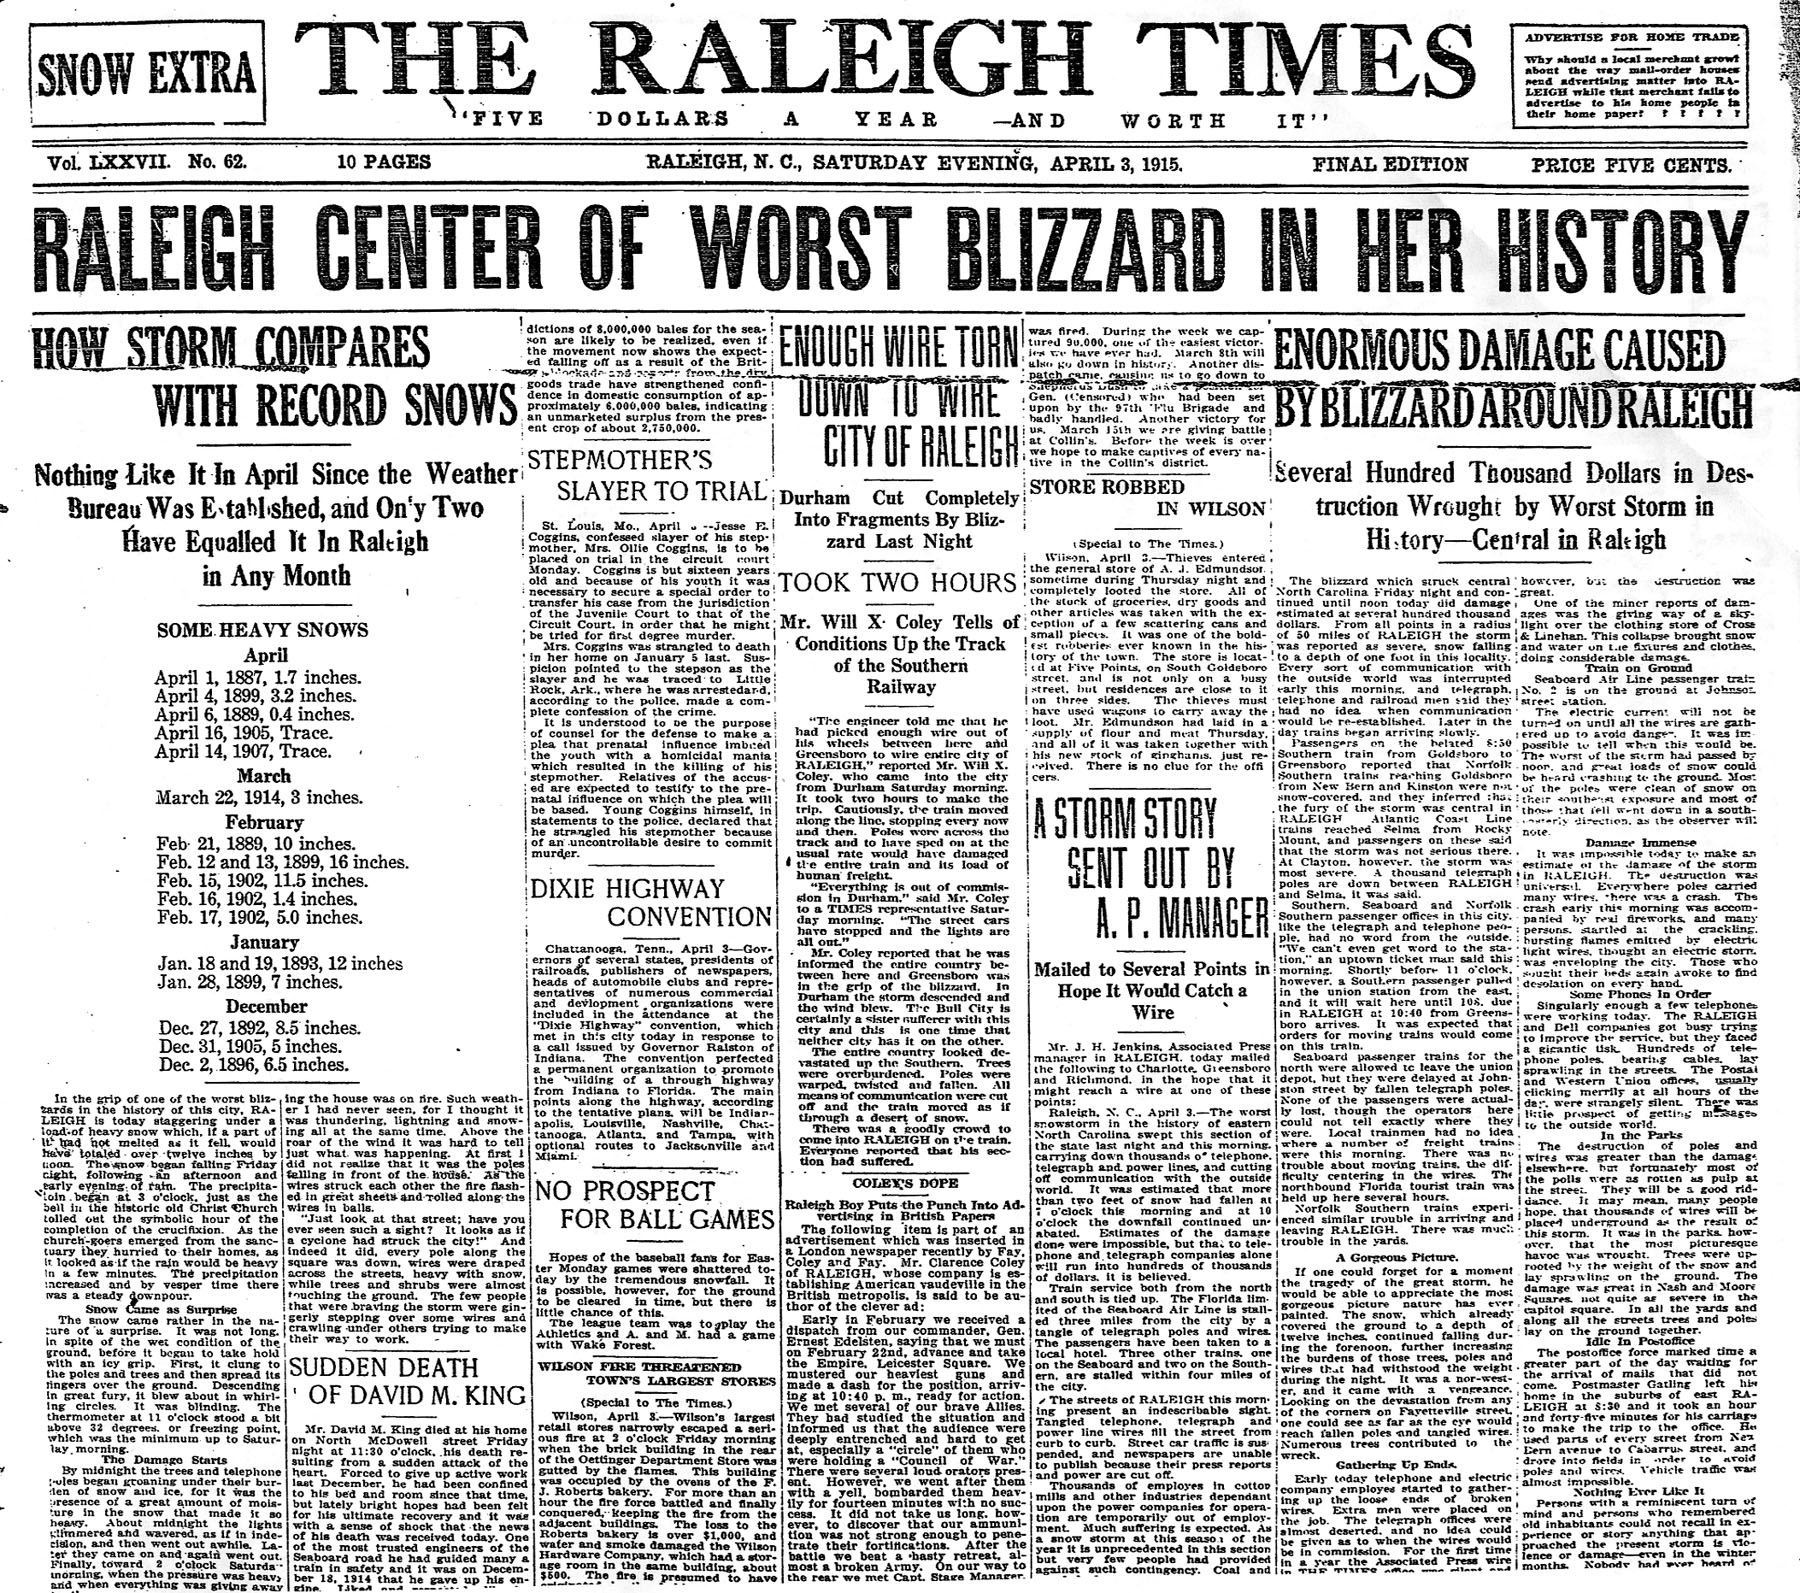
So, applying it to the image corpus:
 |
| http://freepages.genealogy.rootsweb.ancestry.com/~mstone/27Feb1895.jpg |

 |
| http://www.thevictorianmagazine.co.uk/1856%20nov%2022%20web%20size/1856%20nov%2022%20p517.jpg |

 |
| http://www.angelfire.com/pa5/gettysburgpa/23rdpaimages/cecilcountydare2.jpg |
 |
| http://malvernetheatre.org/wp-content/uploads/2012/07/Malverne-Community-Theatre-Newspaper-Reviews-14-page-0.jpg |

 |
| https://upload.wikimedia.org/wikipedia/commons/b/b8/New_York_Times_Frontpage_1914-07-29.png |
 |
| http://www.americanwx.com/bb/uploads/monthly_01_2011/post-382-0-70961700-1295039609.jpg |
 |
| http://s.hswstatic.com/gif/blogs/vip-newspaper-scan-6.jpg |

I probably should have kept the normalization factor, but that would require calculating them and sticking them in the appropriate places in the plot script, and I was just too lazy to do that. Still, this looks like it's a fairly decent way to detect column gaps. The robust statistics do a worse job, probably because they attempt to clean up the kind of deviations that are interesting here. Compared to the baseline level, it looks like the gaps have a factor of about 10 difference. It really only fails when the columns aren't really separated (or they might be, if I bothered normalizing the plots and clipping the range better).
Monday, 23 September 2013
Possible solution to a major problem.
 |
| Allowing me to do this (left: original; right: modified reconstruction). |
I need to test that photometric properties are retained by this transformation, and I'd like to speed it up some and sort out some of the edge case issues (visible around the blank bands above), but I think this solves the bulk of the issues with this problem.
Subscribe to:
Posts (Atom)